BCH Price
BCH Price is determined by exchanges, all of whom decide on a slightly different number. The BCH price is used in technical analysis, by way of, among other techniques, candlestick analysis. When you go on an exchange, or a website that displays the current BCH price, you can often view it either in graphical (chart) form or view it on an API page. The BCH price chart shows the price as it varies over time, and can display windows of a chosen length, say on the order of a week, a month, 6 months, a year, or as far back as the coin existed. Bitcoin Cash Price charts are sometimes accompanied with raw data that can be downloaded for use at home at a certain resolution, often 24 hours, and that data always contains at least the following: high and low price and open and close price. Sometimes other data is included such as mean price or weighted price. Weighted BCH price consists of price averaged across several exchanges. This raw data is constantly updated and if you prefer to download it directly from the domain, they often have an API URL, which is a page for conveniently downloading data using software. The page might consist of the aforementioned parameters and little else in the way of graphical embellishments. The BCH price analysis data at that URL is updated at an interval determined by the exchange. When you “view chart” on a website, in addition to being able to view it for different windows of time, other representations that be helpful for analysis like candlestick BCH price charts are available. Candlestick representation is an old technique developed in Japan for portraying market sentiment. One nice thing about websites providing BCH price, or prices of other coins, is that they often offer you the current price at different fiat currency/coin conversions.
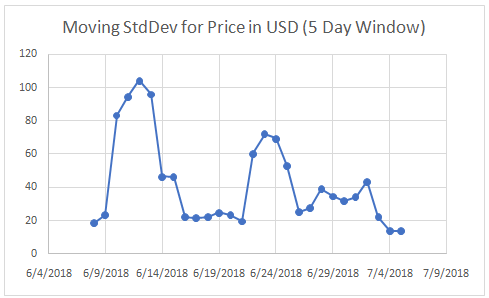
Bitcoin Cash’s behavior since June 18th has mirrored that of BTC, however BCH’s growth following June 29th has been less significant than BTC’s. The BCH price USD has been a rollercoaster the last month, oscillating between roughly the 810s (BCH/USD) and the 650s. The price at the time of publishing is 721.97USD. This is a far cry from May 5th, when it hit a soaring price of 1728.64, following a swift recovery after a prolonged decline from December 2017 and January 2018 (Coinbase). This price activity follows a hack in South Korea, which never bodes well for coin values, an investigation into possible price manipulation of BTC, and an SEC decision that Bitcoin is not a security, which seems like good news for investors of the cryptocurrency. Viewed naively, the secular trend of the last month of price data resembles that in February and March or possibly early April of 2018. From June 8th to July 5th, the standard deviation for price, which may be used as a measure of volatility, was 145.8 USD. The image below shows moving standard deviation for this period with a window length of 5 days, i.e. each point represents the standard deviation for the price on that particular day along with bch prices for the previous 4 days.
Bitcoin Cash’s behavior since June 18th has mirrored that of BTC, however BCH’s growth following June 29th has been less significant than BTC’s. The BCH price USD has been a rollercoaster the last month, oscillating between roughly the 810s (BCH/USD) and the 650s. The price at the time of publishing is 721.97USD. This is a far cry from May 5th, when it hit a soaring price of 1728.64, following a swift recovery after a prolonged decline from December 2017 and January 2018 (Coinbase). This price activity follows a hack in South Korea, which never bodes well for coin values, an investigation into possible price manipulation of BTC, and an SEC decision that Bitcoin is not a security, which seems like good news for investors of the cryptocurrency. Viewed naively, the secular trend of the last month of price data resembles that in February and March or possibly early April of 2018. From June 8th to July 5th, the standard deviation for price, which may be used as a measure of volatility, was 145.8 USD. The image below shows moving standard deviation for this period with a window length of 5 days, i.e. each point represents the standard deviation for the price on that particular day along with bch prices for the previous 4 days.

*Raw data from CoinMarketCap
Resources:
Resources: