Posts

BCH Price August 25

Image
The decline in Bitcoin Cash price from early May continues. This decline has been closely mirrored by the Market Capitalization for the full duration of this interval. Over the shorter-term period of the last month, this correlation is still evident visually, suggesting the two parameters are responding to the same signal. Coin Telegraph notes that following an SEC decision against authorizing 9 proposed BTC ETFs on August 22, the market didn't react harshly as it has in the past to negative SEC rulings. They reason this suggests this was not a crucial assumption in strategies employed by purely speculative investors.This along with resilience to increased cryptocurrency restrictions in China is taken as a sign by Coin Telegraph that bears are diminishing in control. Bloomberg reports that the GTI VERA Convergence Divergence Indicator is signaling a trend reversal is possible for BTC price. This preceded a 39% increase over the next month the previous time this signal was detected

BCH Price August 3

Image
BCH Price correlation to BTC price is .85 for the 90 days ending on Aug 2nd with a P-Value of less than .005, .05 and below being the metric frequently used in academic research to define statistical significance. Between May 29th and Aug 1st, the log return Pearson correlation between BCH and BTC grew. On May 29th, it was .753. Its correlation with Ripple also increased until July 26th, .79 at the start of this interval, though from Jun 26 to July 8th, that increase stagnated, after which, they both increased dramatically. After the 26th of July however, that increase began to reverse. BCH price daily standard deviation from July 3rd to close on August 2nd was 50.07 USD. The strongest non-crypto correlation is with VIX, at .17. The correlation with GLD is -.05, and -.03 and -.1 with TNX and SPX respectively. Ether has a P-Value of .6 with GLD. SC's P-Value with GLD is .78. Tied with Ripple, BTC is not the strongest correlation BCH price has amongst major tokens though it is t

BCH Price July 24 2018

Image
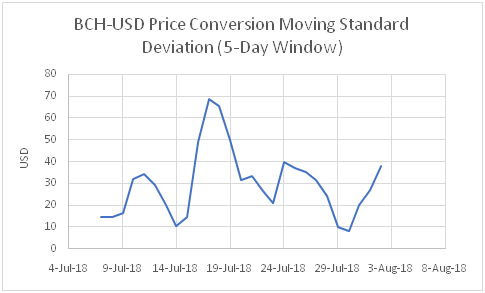
The closing BCH price on July 23rd was 784.39 USD (Pacific Time), according to CoinMarketCap (UTC).The Coinbase exchange worked out a different number for midnight Pacific Time, 8 hrs later, which was 788.70 USD. This is a far cry from May 5th, when it hit a soaring price of 1728.64 USD -according to Coinbase- following a swift recovery after a prolonged decline from December 2017 and January 2018 (Coinbase). Based upon data from CoinMarketCap, from June 26th to July 23rd, the standard deviation for price, which may be used as a measure of volatility, was 145.5 USD. The image below shows moving standard deviation for this period with a window length of 5 days, i.e. each point represents the standard deviation for the price on that particular day along with BCH Prices for the previous 4 days. All CoinMarketCap data reported is for Coordinated Universal Time (UTC). Raw data from CoinMarketCap (Coordinated Universal Time – UTC – 8 hours ahead of Pacific Time) At 11:44 (Pacif

BCH Price

Image
BCH Price is determined by exchanges, all of whom decide on a slightly different number. The BCH price is used in technical analysis, by way of, among other techniques, candlestick analysis. When you go on an exchange, or a website that displays the current BCH price, you can often view it either in graphical (chart) form or view it on an API page. The BCH price chart shows the price as it varies over time, and can display windows of a chosen length, say on the order of a week, a month, 6 months, a year, or as far back as the coin existed. Bitcoin Cash Price charts are sometimes accompanied with raw data that can be downloaded for use at home at a certain resolution, often 24 hours, and that data always contains at least the following: high and low price and open and close price. Sometimes other data is included such as mean price or weighted price. Weighted BCH price consists of price averaged across several exchanges. This raw data is constantly updated and if you prefer to downloa